Designed for valuation clarity, risk context, and homeowner confidence.
Back to work
PropSight
Clearer HDB valuation for homeowners.
Final Year Project distinction platform using 900K+ HDB resale transactions, CatBoost prediction, SHAP explanations, maps, forecasts, and assistant support.
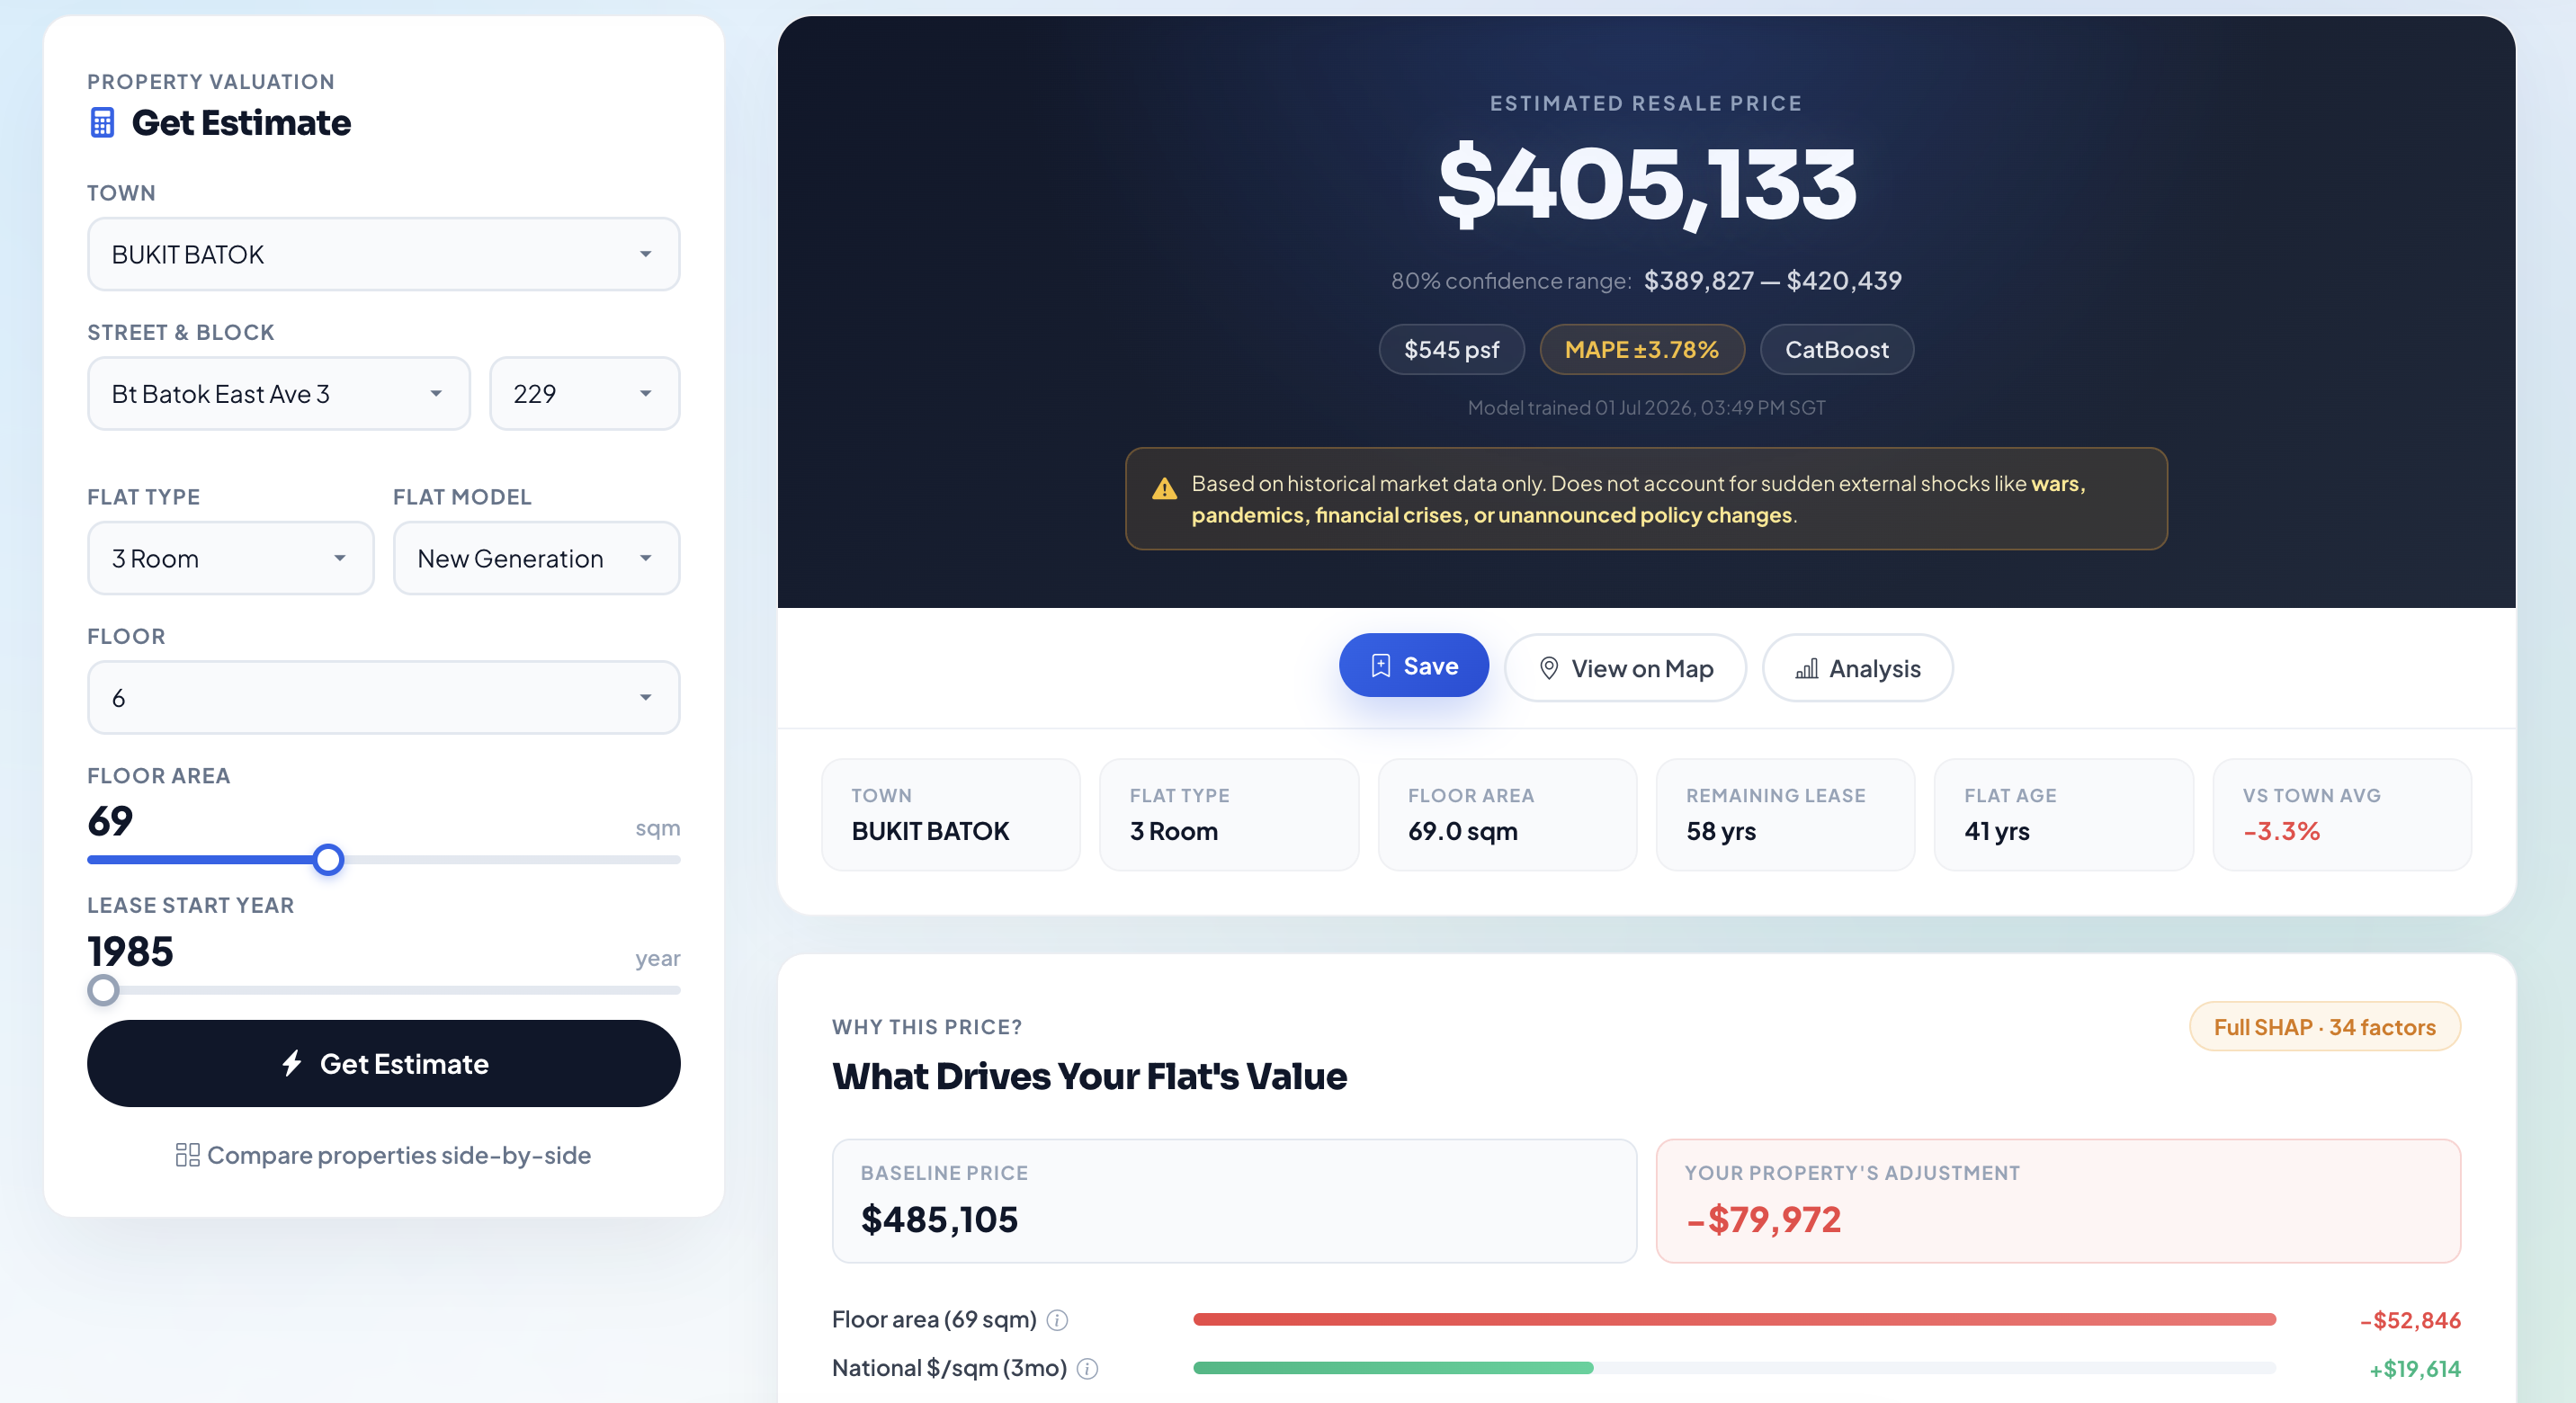
CatBoost prediction, SHAP explanations, and comparables make trust visible.
Trained on 900K+ official resale records and reached 3.7% MAPE on held-out data.
Problem
Price estimates feel opaque.
Homeowners need the factors, confidence, comparables, and future signals behind the number.
Solution
A homeowner-first analytics dashboard.
Prediction, explanation, comparables, heatmaps, forecasts, MRT simulation, and assistant guidance.
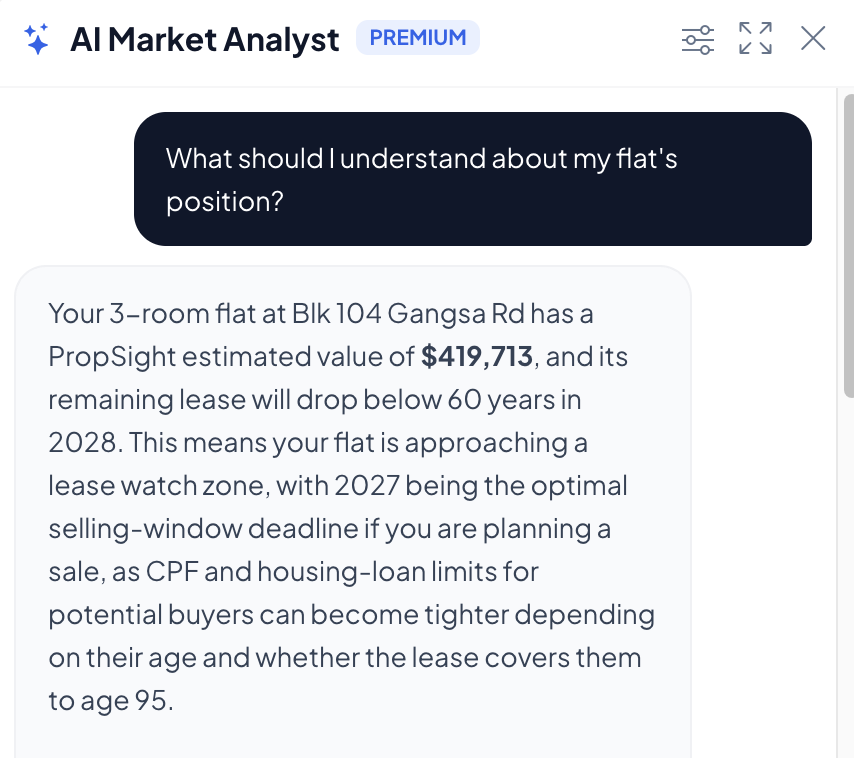
Assistant Layer
The assistant explains without deciding for the user.
The assistant turns dashboard context into plain-language property insight.
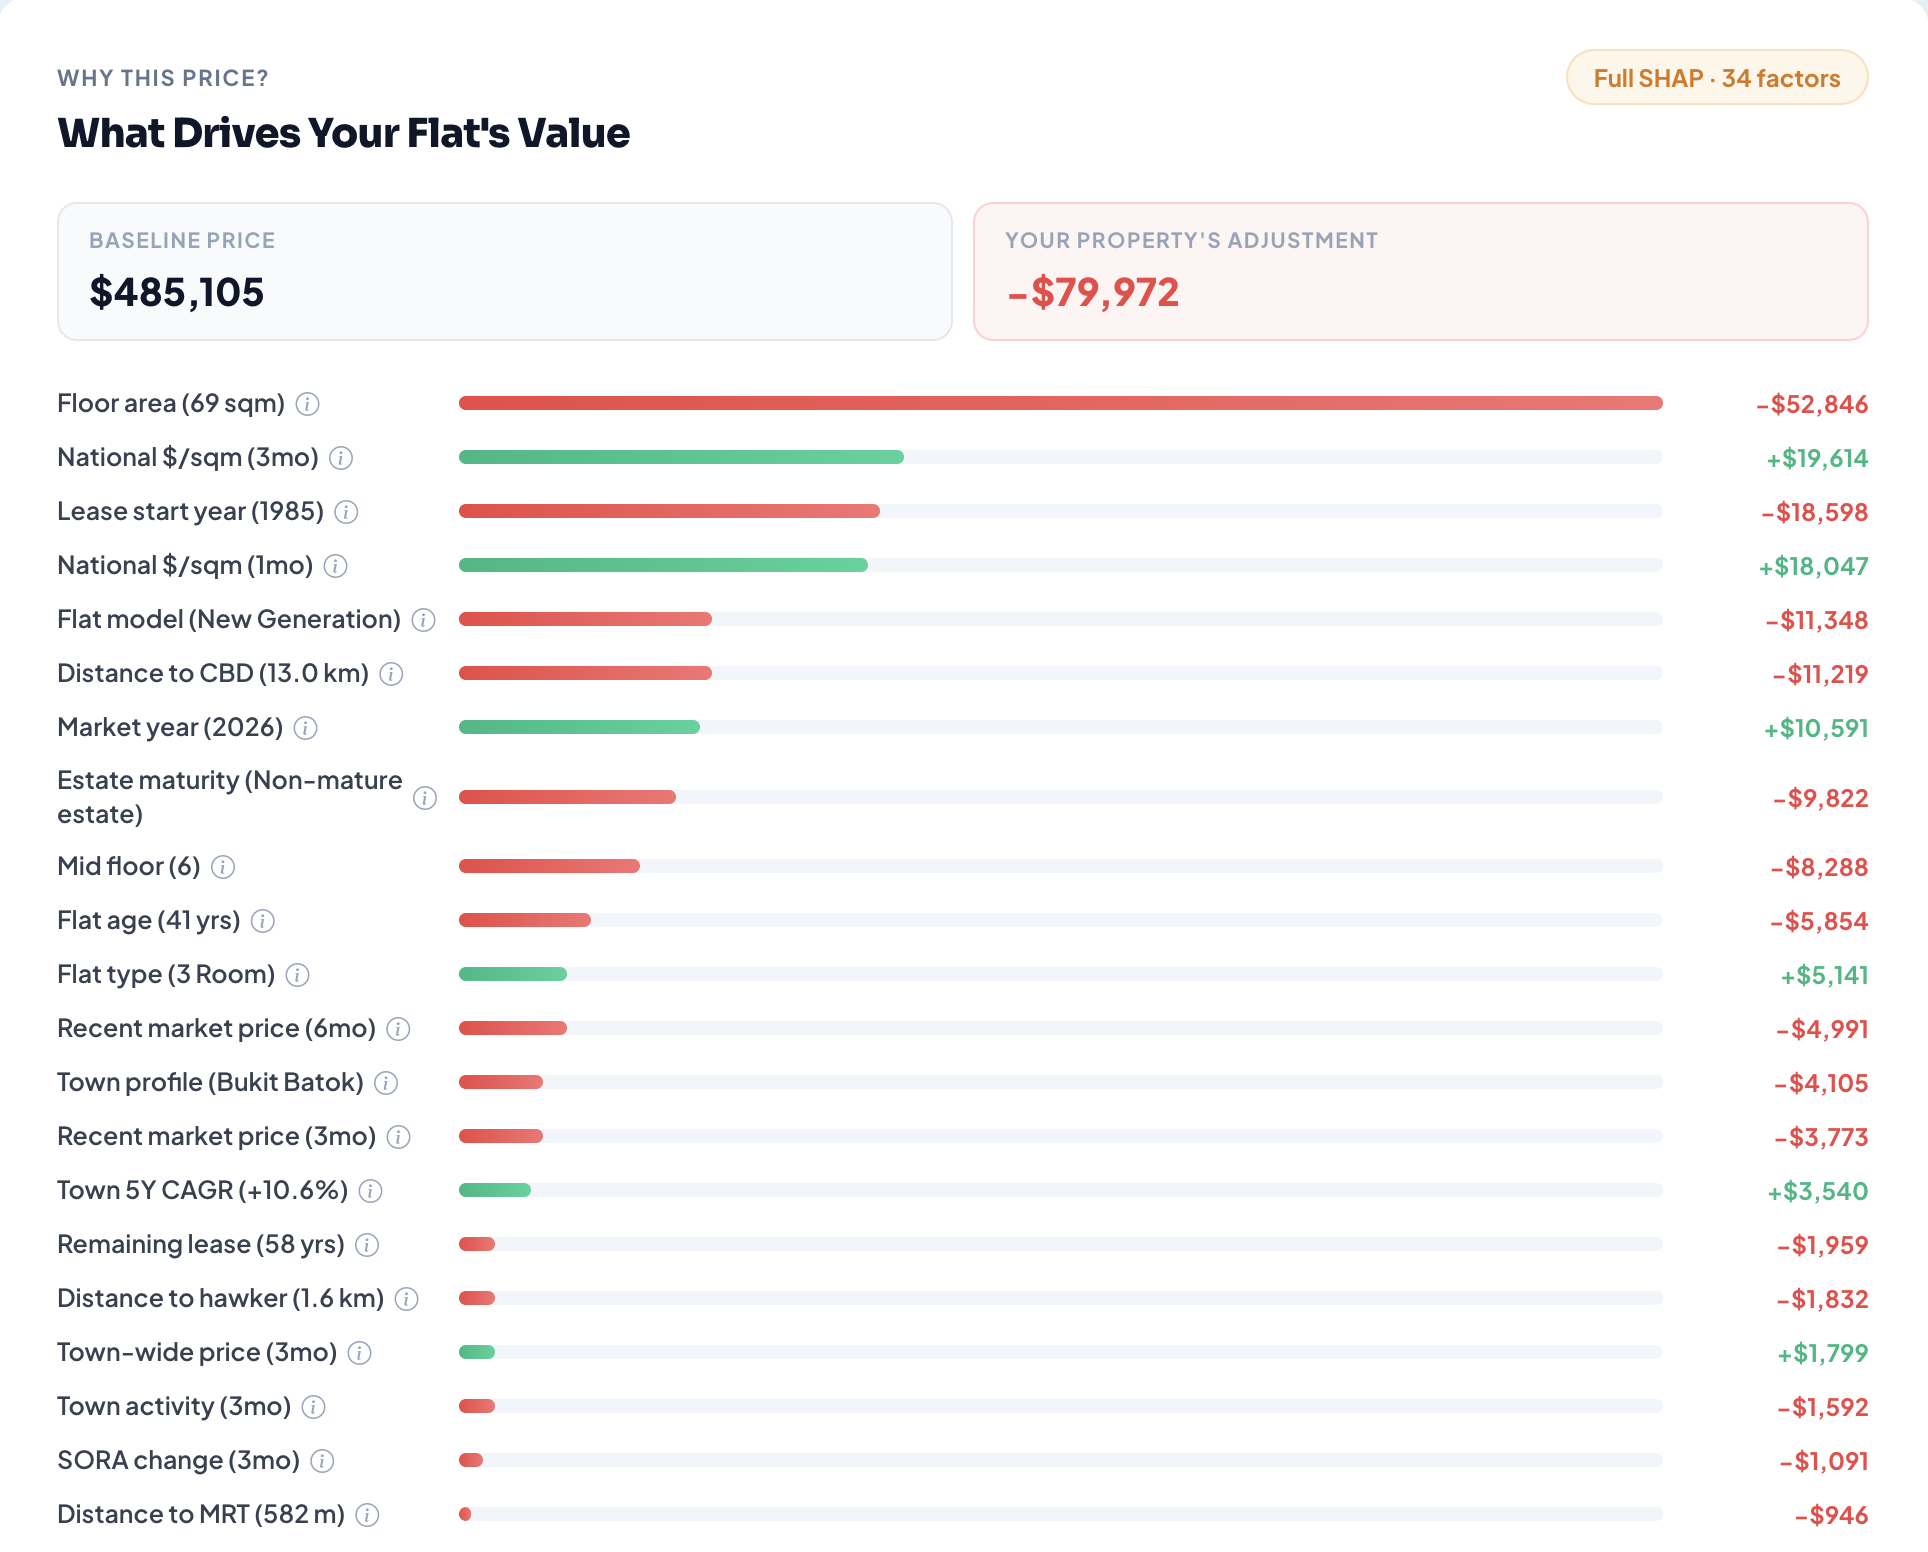
- Plain-language feature contributions.
- Grounded in structured prediction data.
- Supportive, not prescriptive.
Key Features
Explainable Valuation
Shows why a home receives its estimate.
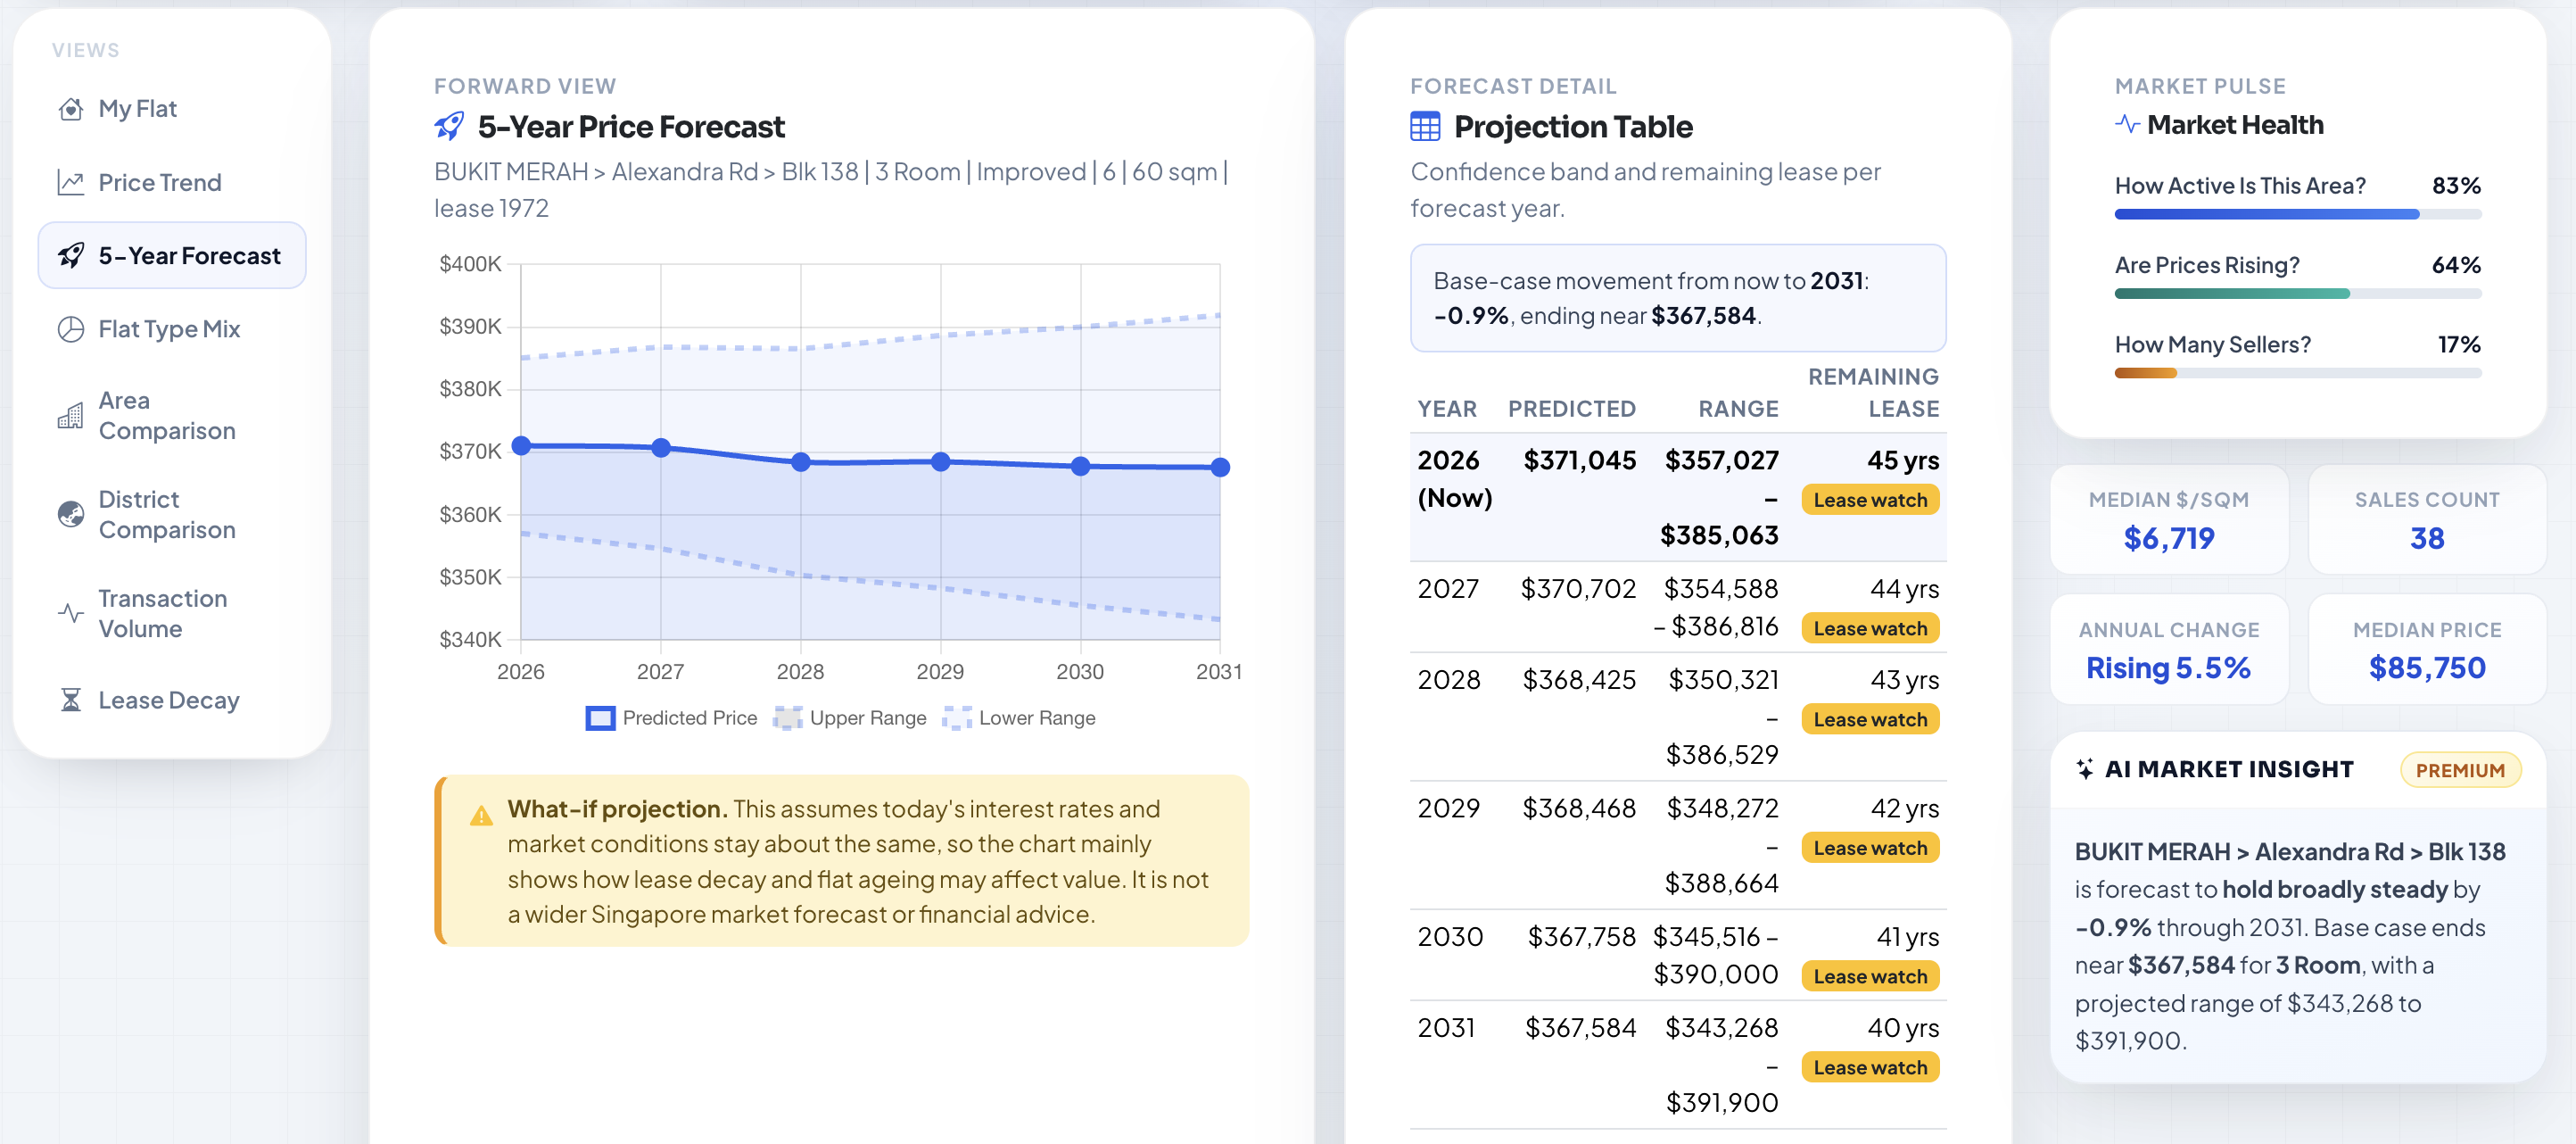
Five-Year Forecast
Shows future value direction beyond today's price.
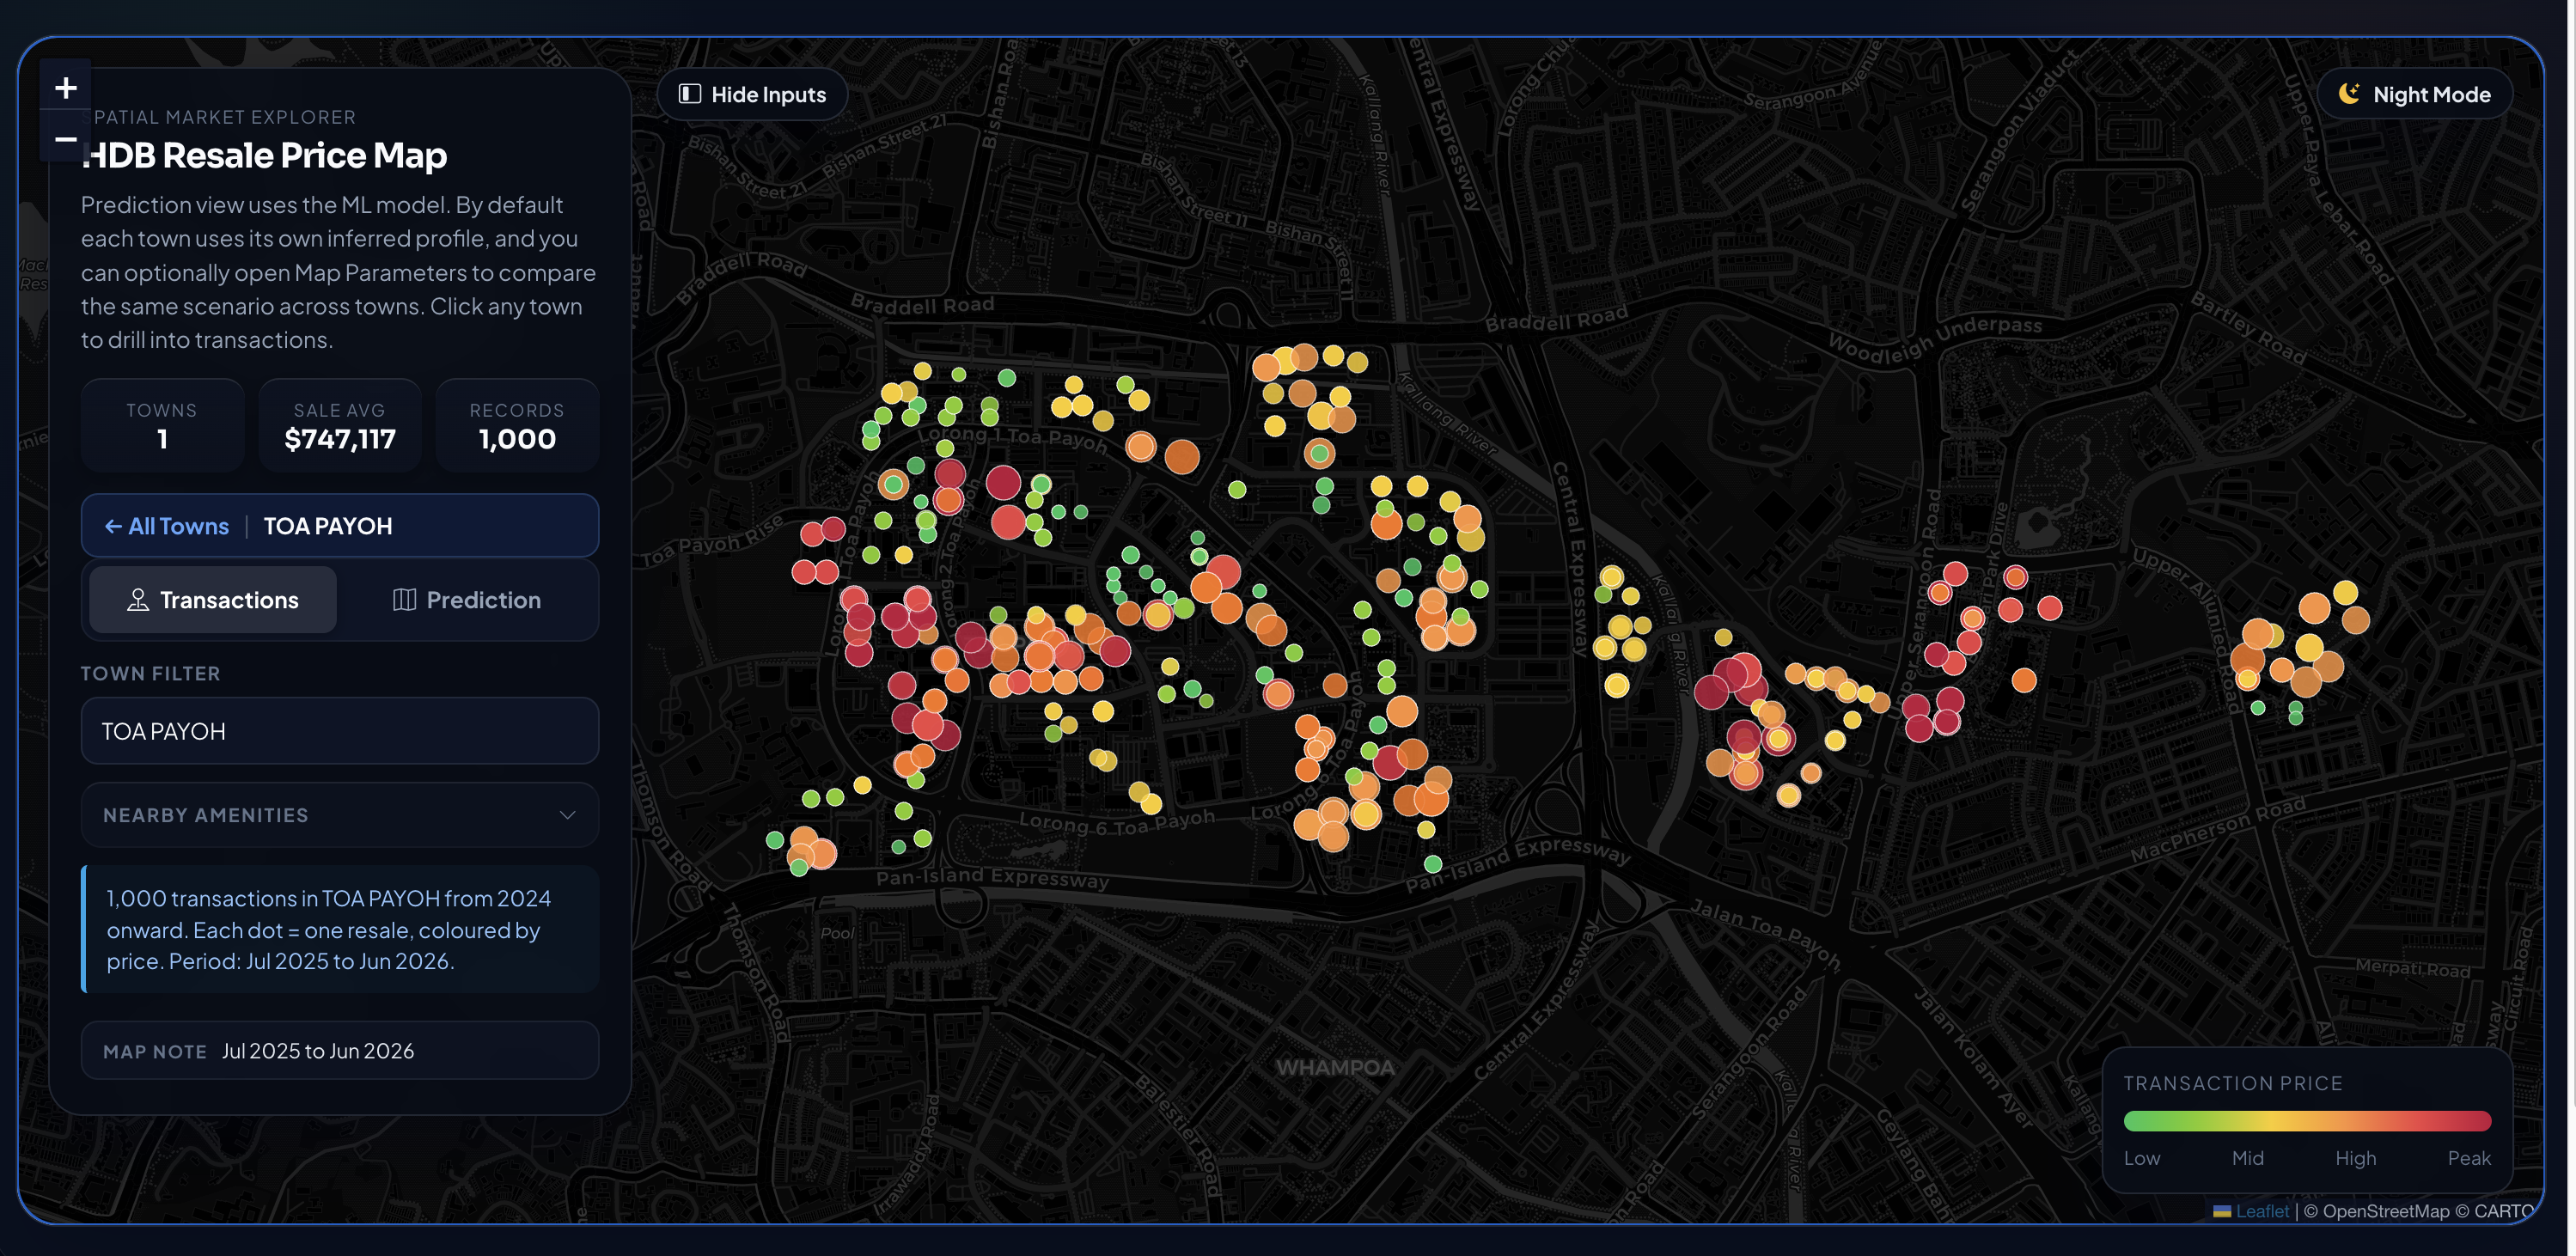
Spatial Heatmap
Reveals location patterns faster than tables.
MRT What-if Simulation
Explores transport impact on future value signals.
Contextual Assistant
Turns analytics into clear explanations.
Admin and User Tiers
Shows product architecture beyond the dashboard.
Design Decisions
Trust before automation.
Prediction first, explanation second, deeper analytics after context is clear.
- Visible uncertainty and comparables.
- Model logic built into the UI.
- Charts and maps over dense tables.
- Assistant framed as context, not advice.
Tech
Frontend for model output, maps, and analytics workflows.
- React dashboard
- Flask backend
- PostgreSQL
- Render deployment
- Prediction API integration
- CatBoost model output
- SHAP TreeExplainer
- Optuna tuning
- Gemini assistant
- Spatial heatmaps
- Forecast simulation
- Role-based user tiers
Reflection
Explainability is product design.
Trust comes from showing reasoning, uncertainty, and context.